Summer TOU Rates Worked Out Well
We are saving money with a Time-of-Use rate through NV Energy.
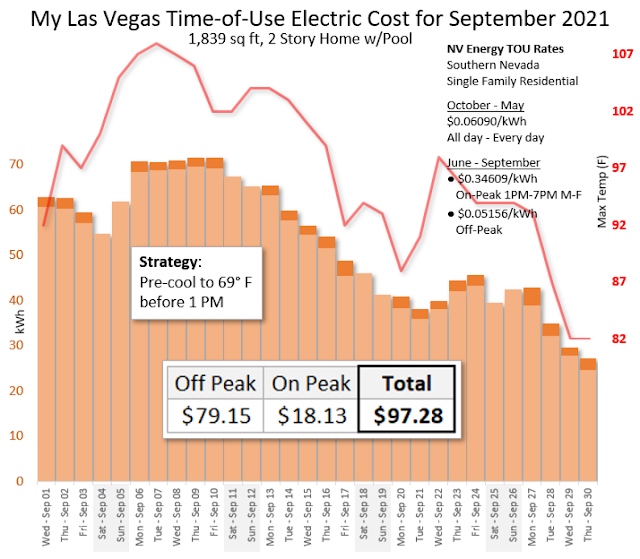
My September electric bill in Las Vegas is about $50 less than it was for the average September living in Southern California. This amazes me, considering our Las Vegas house is about 400 sq ft larger and has a pool pump (load we didn’t have in So Cal) running for a few hours every day.
If we had been on NV Energy’s standard flat rate ($0.10282/kWh) during September, our bill would have been about $150.
During Summer we pre-cool the house to 69° (F) before 1 PM and keep the shutters and curtains closed during the day. We are able to ride out the expensive On-Peak hours in comfort without our A/C kicking on.
NV Energy has some nice infographics on their website including recent usage and billing forecast. Being a data nerd, I like to roll my own reports.
I download my usage data from NV Energy’s website. Just put in the dates you want, hit submit, and you receive a notification email in a few minutes when your data is ready for download.
Most of NV Energy’s residential smart meters record usage in 15 minute intervals. Recording an entry 4 times an hour for 24 hours gives you 96 usage records for the day. In a thirty day month, you will have 2,880 records.
To get daily usage I use the ‘Startdate’, ‘TIME OF USE’, and ‘USAGE’ fields from the results file. Pivot ‘On Peak’ and ‘Off Peak’ usage to their own fields and sum them by date.
SQL:

SELECT a.Startdate,
   SUM(IF(a.[TIME OF USE]="SUMMER_OFF_PEAK",a.USAGE,0)) AS OffPeak,
   SUM(IF(a.[TIME OF USE]="SUMMER_ON_PEAK",a.USAGE,0)) AS OnPeak
FROM Usage2109 a
GROUP BY a.Startdate;
I add the results into an Excel spreadsheet, add columns calculating cost and then add daily weather data from the National Oceanic and Atmospheric Administration (NOAA) website.
